Integrating multiple data sources toward building up a surveillance infrastructure
Principal Investigator

Yajuan Si
Research Associate Professor, Institute for Social Research, University of Michigan
Team Members
- Andrew Gelman, Professor, Department of Statistics; Professor, Department of Political Science, Columbia University
- Jonah Gabry, Staff Associate, Institute for Social and Economic Research and Policy, Columbia University
- Soumojit Das, Postdoctoral Researcher, Institute for Social Research, University of Michigan
- Rayleigh Lei, Postdoctoral Researcher, Institute for Social Research, University of Michigan
- Toan Tran, Research Software Engineer, Institute for Social Research, University of Michigan
- Jon Zelner, Associate Professor, School of Public Health, University of Michigan
- Katherine Li, Research Assistant, Institute for Social Research, University of Michigan
Funded By
National Institute on Minority Health and Health Disparities (NIMHD)
The problem:
The COVID-19 pandemic revealed the importance of an operational surveillance system to allow for prompt data collection and assessment of mitigation efforts. In order to monitor trends over time during a critical period such as a pandemic, it is crucial to have systems in place that can track and model early incidence and transmission rates in communities prior to the time of crises. The researchers in this study propose a new metric for predictions of clinical burdens in hopes of informing future pandemic responses.
The approach:
In this study, the researchers developed a valid proxy metric by applying a multilevel regression and poststratification (MRP) to integrated electronic health records and survey data to estimate community-level transmission. The team tested their proposed metric across case studies via an interface implementing MRP.
The findings:
The researchers found the integrated data infrastructure to be straightforward operationally and an encouraging step for longer-term surveillance monitoring
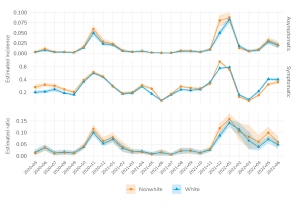
Line graph titled “COVID-19 incidence and ratios by race” showing trends in COVID-19 incidence and ratios by race (Nonwhite and White) from May 2020 to June 2022. There are three panels: the top panel displays estimated incidence of asymptomatic cases, the middle panel displays symptomatic incidence, and the bottom panel shows the estimated ratio of Nonwhite to White cases. Both groups follow similar patterns, with notable peaks around November 2020 and January 2022. Nonwhite individuals (red line) generally show higher asymptomatic incidence and ratios peaked above 0.15 in early 2022. Shaded regions around lines represent one standard error uncertainty. A legend distinguishes Nonwhite (red) and White (blue) groups.
Selected Publications & Presentations
Si, Y., Tran, T., Gabry, J., Morris, M., & Gelman, A. (2024). Multilevel Regression and Poststratification Interface: Application to Track Community-level COVID-19 Viral Transmission. https://doi.org/10.48550/ARXIV.2405.05909