Using place visitation big data to improve health measure estimation at the census tract level
Principal Investigator

Zhenlong Li, Associate Professor, Department of Geography, Pennsylvania State University
Co-Investigators
- Huan Ning, Ph.D. Candidate, Geoinformation and Big Data Research Lab, Department of Geography, University of South Carolina
- Temitope Akinboyewa, Ph.D. Candidate, Geoinformation and Big Data Research Lab, Department of Geography, University of South Carolina
- Fengrui Jing, Postdoctoral Research Fellow, Geoinformation and Big Data Research Lab, Department of Geography, University of South Carolina
- Shan Qiao, Associate Professor, Big Data Health Science Center, University of South Carolina
- Xiaoming Li, Professor, Department of Health Promotion, Education, and Behavior, University of South Carolina
Funded By
Social, Behavioral, and Economic COVID Coordinating Center (SBE CCC)
The Problem
Health measures for small areas (i.e., census tract level health outcomes, prevention, health risk behaviors, and health status) can support effective public health planning for policymakers. Social determinants of health (SDOH) factors are usually applied to generate health measure estimation. However, SDOH lacks consideration of resident routine activities that may affect health measures. For example, more fitness center visitation might relieve depression, and bar trips might increase binge drinking. This study investigated whether the additional resident routine activity information improves health measure estimation in areas with small populations (i.e., census tract) in the United States (US), and whether such improvement is different between urban and rural areas.
The Approach
We collected SDOH data and resident routine activity information at the census tract level in the US and conducted hierarchical linear regression. SDOH contains 12 variables derived from American Community Survey 5-Year Estimates 2019 (ACS 2019), such as race, education, and income. Routine activity information consisted of per capita visitors of tracts to 120 categories of places (e.g., fastfood restaurants, parks, and drinking places) in 2019, derived from smartphone-based place visitation big data obtained from SafeGraph. The health measures (N=22) were extracted from the Population-Level Analysis and Community Estimates (PLACES) dataset from the Centers for Disease Control and Prevention (CDC). The urban-rural classification is based on the “Tract level Rural-Urban Commuting Area Codes (RUCA Codes)” from the USDA Economic Research Service. In this analysis, we categorized the tracts within metropolitan areas as the urban tracts based on the RUCA codes, and the rest of the tracts are denoted as rural tracts (including micropolitan areas, small towns, rural areas). Hierarchical regression using SDOH with and without visitation data was conducted to examine whether including resident routine activity information improves the model explanation power to the 22 health measures in PLACES.
The Findings
The analysis results showed that SDOH factors contributed the most variance to each of the 22 health measures in the US (mean r2 = 0.732, total number of tracts included in the analysis: N = 64,753). Place visitation data increased the prediction performance of all health measures with significant urban-rural differences (mean r2 increased by 8.4% for all tracts; 8.3% for urban tracts, N= 56,276; and 16.6% for rural tracts, N = 8,477). The performance improvements varied among health measures. The top six health measures that benefited with more than 10% performance improvements in urban tarcts include Binge Drinking (37.7%), Visits to Doctor for Routine Checkup (22.4%), Talking Medicine for High Blood Pressure Control (19.8%), High cholesterol who have been screened in the past 5 years (18.7%), Depression (12.9%), and Obesity (11.9%). For rural areas, 16 out of the 22 health measures benefited with more than 10% performance improvements with the top six including Binge Drinking (53.9%), Depression (45.8%),High cholesterol who have been screened in the past 5 years (34.0%), Talking Medicine for High Blood Pressure Control (30.1%), Visits to Doctor for Routine Checkup (24.9%), and Arthritis (20.8%). Further analysis of Binge Drinking, which exhibited the largest gains, revealed that the most influential two place categories in urban areas were Drinking Places (Alcoholic Beverages) and Gasoline Stations with Convenience Stores. In rural areas, the top two categories were Drinking Places (Alcoholic Beverages) and Colleges, Universities, and Professional Schools.
These findings demonstrate that incorporating routine activity information derived from place visitation big data enhances health measure estimation at the census tract level, particularly for measures of health risk behaviors linked to specific activities, such as Binge Drinking and Routine Doctor for Routine Checkup. The results also suggest rural-urban differences with the greater improvements observed in rural areas, which highlights the potential of this approach to address disparities in health measure estimation. In conclusion, this study revealed that the visitation data can be a valuable auxiliary data source to traditional SDOH factors for health measure estimation, and provided researchers with new insights into the association between the place-based health measures and resident routing activities.
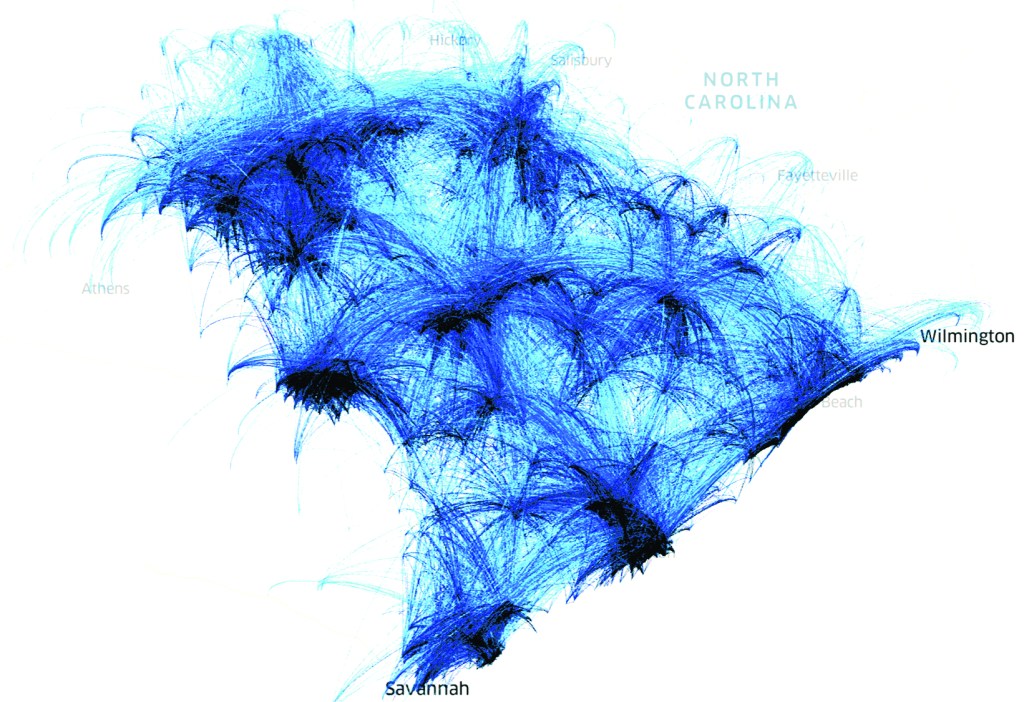
Visualization of the visitation flows from home blockgroup to over 3,000 fast-food restaurants in South Carolina in January 2019.