Shifting rural-urban incidence and outcomes of acute myocardial infarction in Medicare beneficiaries
Principal Investigator

Karen Joynt Maddox
Associate Professor, Washington University School of Medicine in St. Louis
Co-Investigators
- RJ Waken, Instructor, Division of Biostatistics, Washington University School of Medicine in St. Louis
- Fengxian Wang, Statistical Data Analyst, Washington University School of Medicine in St. Louis
- Osvaldo Laurido-Soto, Assistant Professor, Neurology Division of Vascular Neurology
- Khavya Avula, Public Health Research Coordinator, The Health Outcomes, Policy, and Evaluation (HOPE) Lab
Funded By
The problem:
COVID was associated with major care disruptions, including to cardiovascular care.
Studies reported profound drops in acute myocardial infarction (AMI) during the pandemic, but the longerterm effects on incidence and outcomes are unclear. This is particularly true for rural communities, where resources were severely strained and economic downturns have been slower to recover. The researchers in this study aim to determine whether there were changes during and post-COVID in incidence, treatment, and/or outcomes for acute myocardial infarction.
The approach:
This team used the Centers for Medicare & Medicaid Services (CMS) Virtual Research Data Center to analyze utilization patterns for all Medicare beneficiaries from 2018–2022 (Fee for Service and Medicare Advantage). The researchers defined AMI hospitalizations as any emergency department, observational, or inpatient stay with a primary ST-elevation myocardial infarction (STEMI) or non-ST-elevation myocardial infarction (NSTEMI) diagnosis or primary cardiogenic shock and secondary STEMI or NSTEMI diagnosis. Hospital revisits were quantified as any subsequent hospitalization (at any hospital) within 3, 30, or 90 days of discharge.
The findings:
During the pandemic, AMI incidence declined, then continued on a slightly downward trend post-pandemic. Additionally, during the pandemic, mortality was higher, but readmissions were lower, particularly in rural areas.
Post-pandemic, mortality has recovered among urban, but not rural beneficiaries. Readmissions remain down across geographies.
The research team noted a few limitations with their study. For one, the sample only considers those on Medicare, which provides few insights into workingage adults. Further, the researchers focused on fee for service, though they plan to broaden this focus in the future. While the researchers account for days at risk and comorbidities, unmeasured confounding is still possible. Crucially, analyses can only account for COVID where there is a claim such that if a claim was not made, researchers did not have clear insight.
COVID was associated with meaningful shifts in mortality and readmissions for Medicare beneficiaries with AMI. While researchers initially expected care disruption to be a big player, this study revealed these changes to be more durable and that disruptions were likely due to differences in care-seeking and potentially due to differences in underlying patterns of illness. A combination of increased mortality and decreased hospital revisits suggest these new patterns of utilization may not be optimal, raising concern that some of the newer utilization patterns reflect an inappropriate decrease in access and utilization of emergency departments for some of these conditions.
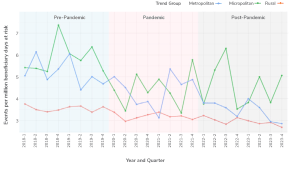
Line graph titled “STEMI events per million beneficiary days at risk,” showing STEMI events per million beneficiary days at risk, from 2018 to 2023, divided into Pre-Pandemic (shaded blue, 2018-Q1 to 2020-Q1), Pandemic (shaded pink, 2020-Q2 to 2021-Q4), and Post-Pandemic (unshaded, 2022-Q1 to 2023-Q4) periods. The x-axis represents year and quarter; the y-axis represents event rate. Three trend groups are shown: Metropolitan (red), Micropolitan (green), and Rural (blue). Metropolitan rates are consistently lower (around 3–4 events), while Micropolitan and Rural rates fluctuate more, with Micropolitan peaking above 7 events pre-pandemic and experiencing variable rates throughout. Rural rates start around 6, decline somewhat during the pandemic, and continue to fluctuate post-pandemic. Color shading distinguishes each period. Trend group labels are shown on the right.