Association of county-level COVID-19 policy comprehensiveness and adult behavioral health during 2020-2021; findings from two national surveys
Principal Investigator

Rita Hamad
Director, Social Policies for Health Equity Research Center, T.H. Chan School of Public Health, Harvard University
Co-Investigators
- Emily Dore, Postdoctoral Research Fellow, Social and Behavioral Sciences, T.H. Chan School of Public Health, Harvard University
- Emily Wright, Postdoctoral Research Fellow, SPHERE Center, T.H. Chan School of Public Health, Harvard University
- Kaitlyn Jackson, Senior Statistical Analyst, T.H. Chan School of Public Health, Harvard University
- Guangyi Wang, Research Associate, Department of Social and Behavioral Sciences, T.H. Chan School of Public Health, Harvard University
- Mark J. Pletcher, Professor, Department of Epidemiology and Biostatistics, University of California, San Francisco
- Thomas W. Carton, Director of Analytics, Louisiana Public Health Institute
Funded By
The problem:
While there are studies that provide evidence on the effects of state-level policies on short-term behavioral health outcomes, few studies examine the effects of county-level policies. Even fewer studies examine the impacts of public health and containment policies in comparison to studies that analyze economic policies.
Having first created the U.S. COVID-19 County Policy (UCCP) Database to categorize geographic and temporal variation in COVID policies, Rita Hamad and her colleagues now seek to examine how county-level COVID-related policies either contributed to or ameliorated pandemic-related disparities in mental health and health behaviors.
The approach:
In two different studies, the team examines how COVID19-era county-level policies affected adult mental and behavioral health, including substance use, across the U.S. The researchers carried out their analyses by connecting the UCCP Database with two individual-level health datasets: (1) the National Survey on Drug Use and Health (NSDUH) in a study published in the Journal of Urban Health and (2) the Behavioral Risk Factor Surveillance System (BRFSS) in a study currently under review.
By linking the UCCP database to national behavioral health surveys, the team seeks to better understand the effects of policies on short-term behavioral health outcomes–such as drinking, smoking, and drug use. The team further aims to unpack the ways in which the effects vary by subgroup (i.e. race, ethnicity, sex, education-level) as well as by county-level variables such as urbanicity and political partisanship. These behavioral health outcomes were of particular interest as they are more responsive in the short-term to policy changes.
The UCCP Database captures county-level policies passed in response to the COVID-19 pandemic. The database was created by Hamad and her team who retrospectively gathered weekly policy data from 2020– 2021 on 27 individual policies for over 300 counties across all 50 states and Washington, D.C.–representing over half of the U.S. population. The 27 policies broadly cover 3 domains: (1) containment and closure policies, (2) economic response policies, and (3) public health policies. These data are publicly available for download via ICPSR.
Using policy data from the UCCP Database, the researchers created measures of policy comprehensiveness by aggregating individual policies into an overall score and into three domains: (1) containment/closure, (2) economic response, and (3) public health. Outcomes included use and frequency of use of substances, as well as, days of psychological distress. The researchers then modeled policy comprehensiveness with these behavioral health outcomes to examine resulting associations.
The findings:
In the study using data from NSDUH, the team found no overall impact of stricter policies on behavioral health. That is to say, increases in overall policy comprehensiveness were not associated with the behavioral health outcomes assessed. However, stratified models did find some variability in associations across sex, racial/ethnic, education, and urban subgroups.
In the study using data from BRFSS, the team found that greater containment policy and total comprehensiveness was associated with a lower likelihood of any alcohol use and fewer poor physical health days, and that greater containment policy comprehensiveness was also associated with a lower likelihood of any binge alcohol use. These associations also differed by subgroups. The difference in findings across studies may be at least partially attributed to the fact that the NSDUH study only examined policy exposures in 2021 due to data limitations, while the BRFSS study examined policy exposures in 2020 and 2021.
These findings suggest local policies may have contributed to health disparities and highlight the need for more research to triangulate these datasets and to better guide future public health decisions.
The team’s next aim is to estimate the association of county-level COVID-related policies with disparities in healthcare utilization for mental health problems.
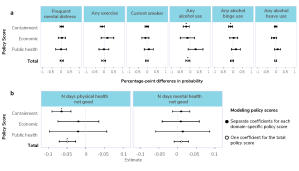
Figure titled “Associations between policy scores and health outcomes” with two panels (a and b) presenting estimates and confidence intervals for associations between policy scores and health outcomes.
Panel a: Six vertical dot plots showing the percentage-point difference in probability for each outcome: Frequent mental distress, Any exercise, Current smoker, Any alcohol use, Any binge alcohol use, Any heavy alcohol use. Each plot includes four rows for policy scores (Containment, Economic, Public health, Total), with black circles representing estimates and horizontal error bars for confidence intervals. Statistically significant results are marked with asterisks (*).
Panel b: Two vertical dot plots for N days physical health not good and N days mental health not good, showing estimates for policy scores (Containment, Economic, Public health, Total). Black circles represent domain-specific coefficients, and open circles indicate the total policy score. Confidence intervals are shown as horizontal error bars. Significant results are marked with asterisks (*).
A legend on the right explains symbols used: black circle for domain-specific coefficients, open circle for total policy score.
X-axes are labeled as “Percentage-point difference in probability” (panel a) and “Estimate” (panel b), ranging from negative to positive values.
Selected Publications & Presentations
Hamad, R., Lyman, K. A., Lin, F., Modrow, M. F., Ozluk, P., Azar, K. M. J., Goodin, A., Isasi, C. R., Kitzman, H. E., Knight, S. J., Marcus, G. M., McMahill-Walraven, C. N., Meissner, P., Nair, V., O’Brien, E. C., Olgin, J. E., Peyser, N. D., Sylwestrzak, G., Williams, N., … Carton, T. (2022). The U.S. COVID-19 County Policy Database: a novel resource to support pandemic-related research. BMC Public Health, 22(1), 1882. https://doi.org/10.1186/s12889-022-14132-6
Batra, A., Jackson, K., & Hamad, R. (2023). Effects Of The 2021 Expanded Child Tax Credit On Adults’ Mental Health: A Quasi-Experimental Study. Health Affairs, 42(1), 74–82. https://doi.org/10.1377/hlthaff.2022.00733
Jackson, K. E., Chiang, A. Y., & Hamad, R. (2024). The association of increased SNAP benefits during COVID-19 with food insufficiency and anxiety among US adults: a quasi-experimental study. Public Health Nutrition, 27(e186), 1–11. https://doi.org/10.1017/S1368980024001447