Infographics | Consumer Expenditure Survey Summary Tables
– Average Annual Consumer Expenditures on Select Cultural Activities, 2017-2021
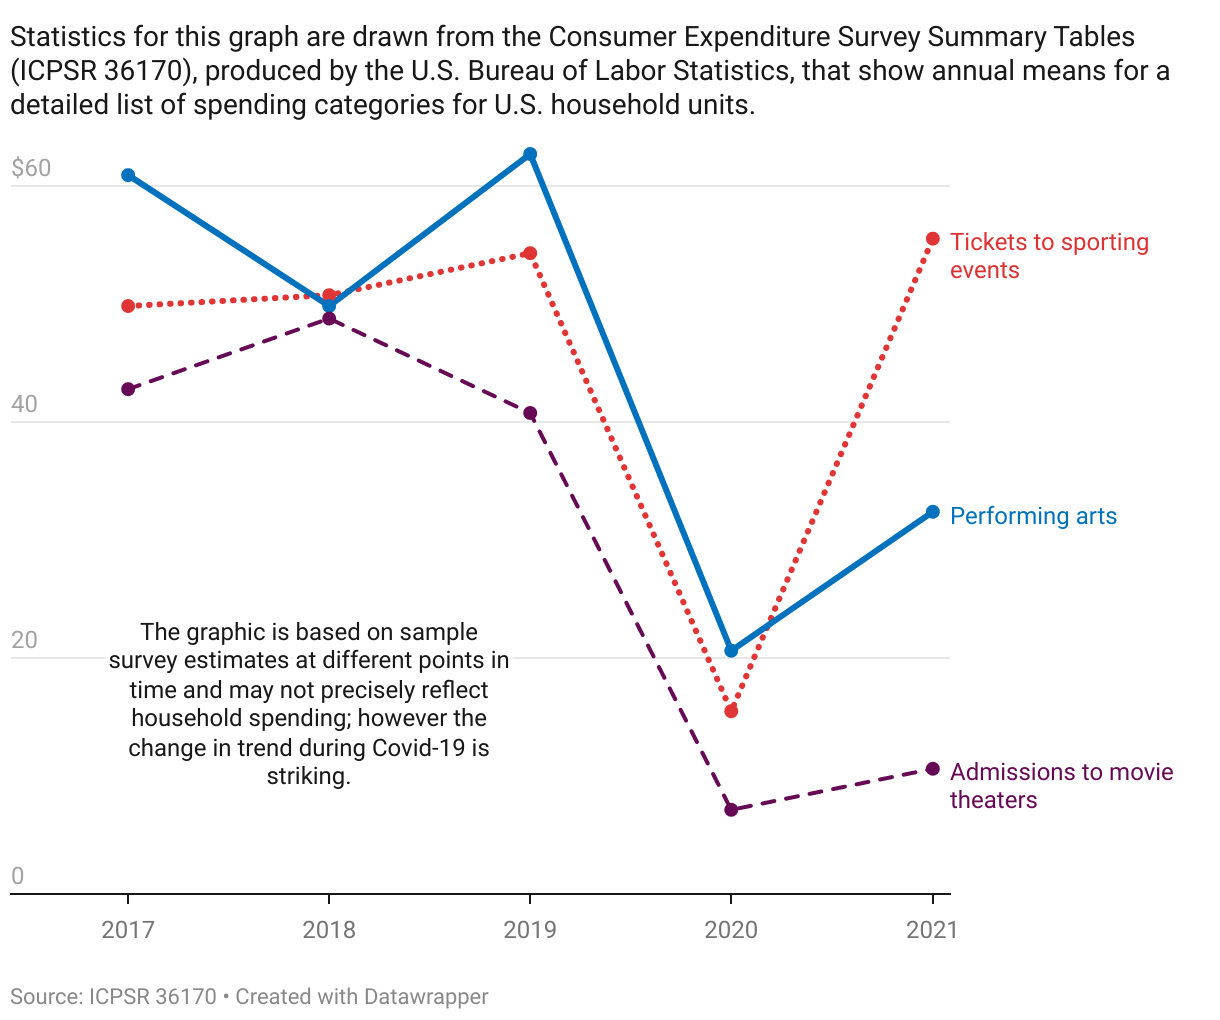
Statistics for this graph are drawn from the Consumer Expenditure Survey Summary Tables (ICPSR 36170), produced by the U.S. Bureau of Labor Statistics, that show annual means for a detailed list of spending categories for U.S. household units.
Average Annual Consumer Expenditures on Select Cultural Activities, 2017-2021 (U.S. households)
| Spending Category | 2017 | 2018 | 2019 | 2020 | 2021 |
|---|---|---|---|---|---|
| Performing arts | $60.90 | $66.61 | $62.69 | $20.61 | $32.38 |
| Tickets to sporting events | $49.81 | $50.73 | $54.29 | $15.48 | $55.52 |
| Admissions to movie theaters | $42.77 | $48.75 | $40.75 | $7.13 | $10.61 |